Over the past three decades, G20 countries have navigated a complex path in tackling per capita greenhouse gas emissions. Data from the European Commission’s EDGAR show that the gap between developed and developing economies persists, but the changes over time are striking. In 2024, the highest emissions are still recorded in countries whose economies are closely tied to fossil fuel extraction and consumption. However, Europe and Japan are showing significant decreases, while China and India continue to increase their volumes, although they remain behind in absolute terms.
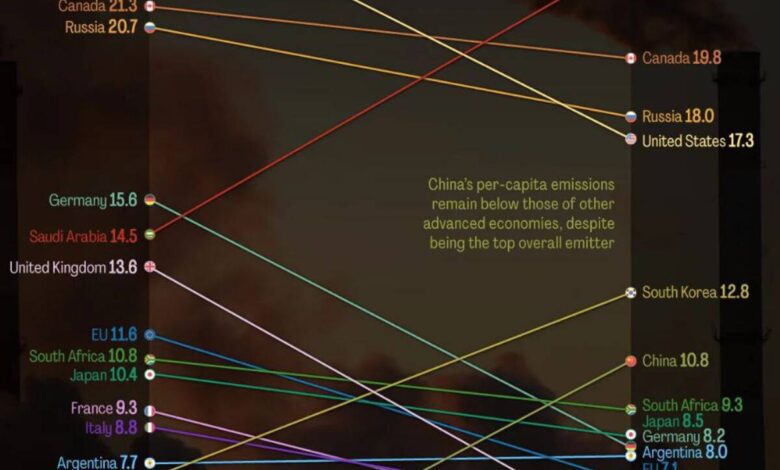
Saudi Arabia, Australia, Canada, and the United States lead in per capita emissions. In these countries, each resident accounts for 17 to 23 tons of CO₂ equivalent per year. The main factors are high dependence on oil, coal, and gas, advanced transportation infrastructure, and high consumption levels. Russia is also among the top five, trailing only behind the countries with the most energy-intensive economies.
Meanwhile, Western European countries, despite their industrial past, have managed to significantly reduce emissions. Germany, the United Kingdom, France, and Italy have halved their figures over the past 34 years. This was made possible by switching to renewable energy, adopting energy-efficient technologies, and making structural changes in their economies.
Growth and decline
China and South Korea have shown the most significant increase in per capita emissions over recent decades. In China, this figure has more than tripled—from 3.17 to 10.81 tons. South Korea has also approached the level of developed countries, driven by rapid industrial and energy sector growth.
Turkey, Indonesia, and India, despite economic growth, remain among the countries with the lowest emissions per capita. In India and Indonesia, emissions per resident are several times lower than in the USA or Canada. This is due to a smaller share of heavy industry and lower per capita energy consumption.
Japan, despite its high population density and developed industry, managed to reduce its emissions from 10.4 to 8.5 tons per capita. This was the result of large-scale energy reforms and a shift to cleaner technologies.
European experience
The United Kingdom and Germany have set an example for other countries by showing that emissions can be reduced even with continued economic growth. In the UK, per capita emissions decreased from 13.6 to 5.6 tons, and in Germany—from 15.6 to 8.2 tons. France and Italy have also achieved significant progress, cutting emissions by almost half.
In European Union countries, the overall downward trend is due not only to the shift toward renewable energy sources, but also to proactive government policies in the field of ecology. The introduction of energy efficiency standards, support for green technologies, and the phasing out of coal have become key factors for success.
At the same time, despite overall progress, some EU countries face challenges due to their dependence on traditional energy sources and the slow adoption of new technologies.
North America and Australia
The United States and Canada remain among the world’s leaders in per capita emissions. In 2024, this figure reached 17.3 tons in the U.S. and 19.8 tons in Canada. Australia also shows a high level—22.3 tons per person. The main reasons are vast territories, developed transportation systems, and a high share of coal in the energy mix.
Despite efforts to transition to renewable energy sources, the pace of emission reductions in these countries remains lower than in Europe. Canada and Australia continue to be highly dependent on fossil fuel extraction and exports, making rapid change difficult.
The U.S. is seeing a gradual decline in emissions, but the country still ranks among the leaders in this indicator among developed economies.
Global trends
Overall, over the past 34 years, G20 countries have shown divergent trends. Advanced European economies and Japan have managed to significantly reduce emissions, while China, South Korea, and Turkey have increased theirs. India and Indonesia remain at low levels despite economic growth.
Experts note that further emission reductions are only possible with a comprehensive approach: developing renewable energy, improving energy efficiency, and changing consumption patterns. The question remains whether the world’s largest economies can achieve their climate goals in the coming decades.
In case you didn’t know, the G20 is a group of the world’s 19 largest economies and the European Union, bringing together leading developed and developing nations. The organization was established to discuss and coordinate economic policy at the global level. Environmental and climate issues are taking on an increasingly important role in the G20 agenda, and greenhouse gas emission data are used to evaluate the effectiveness of national strategies and international agreements.