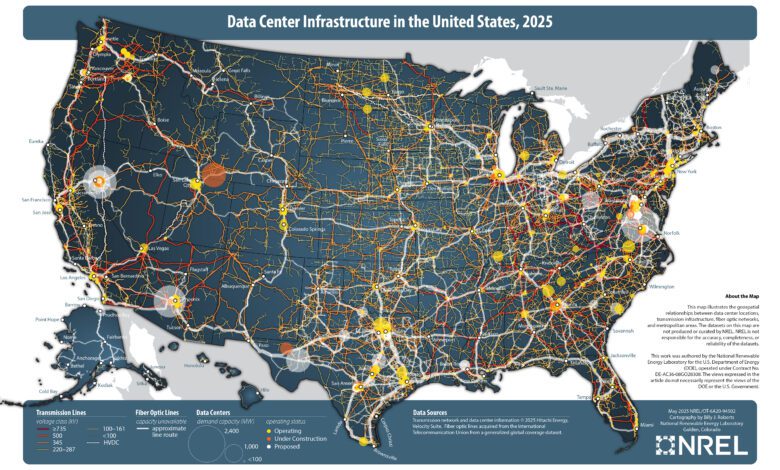
In 2025, the United States released a detailed map depicting the complex network of data center locations, power lines, fiber optic highways, and major urban agglomerations. The work was created by a cartographer from the National Renewable Energy Laboratory (NREL), who combined data on the country’s key digital infrastructure facilities into a single system.
The infographic reveals the close interconnection between modern computing power, energy hubs, and data transmission routes. Special attention is given to regions where the power grid is already nearing capacity, as well as areas expected to see increased electricity consumption in the coming years due to data center expansion.
Virginia Leads in Data Capacity: Why Are So Many Data Centers Located Here?
The map clearly shows that Loudoun County, Virginia, is the undisputed leader in installed capacity. This area has formed what is known as the ‘Data Center Alley’—the largest concentration of computing facilities in the country. Nearly 6,000 megawatts of capacity are already in operation here, with plans to bring another 6,300 megawatts online in the coming years.
This distribution is due to several factors: a developed energy infrastructure, the presence of major fiber optic networks, and proximity to metropolitan areas. In addition, the region offers favorable conditions for investment in the digital economy, attracting leading global operators.
Secrecy and restrictions: Why the map isn’t interactive
Only open sources were used in creating the map. However, some sites—especially those linked to critical infrastructure—cannot be disclosed publicly. As a result, the author had to abandon the idea of making the map interactive, as this could have violated security requirements.
The outcome is a static, yet highly informative overview that allows not only an assessment of the current state of affairs, but also a forecast of where future bottlenecks in energy supply and data transmission may arise.
Development trends: What’s next for the industry?
The US data center sector continues its rapid growth. New facilities are appearing across the country, but information on complexes under construction is often updated with a delay. This is due both to commercial confidentiality and the need to account for changes in energy and telecommunications networks.
Experts note that demand for computing power will only continue to grow in the coming years. This will drive further development of infrastructure, the emergence of new energy hubs, and the expansion of fiber optic networks. At the same time, some regions are already facing challenges in ensuring stable energy supply for new data centers.
The significance of the map for business and government
The appearance of such a map has become an important tool for planning the development of the digital economy. It helps companies choose optimal locations for new facilities, while enabling government agencies to assess risks and plan infrastructure upgrades.
As digitalization penetrates every sphere of life, the effective allocation of computing power and resources becomes a key factor for the country’s competitiveness in the global market.