The global economic map is constantly evolving, and the world’s largest metropolises are fiercely competing for the status of leading financial centers. In 2025, analysts once again reassessed the positions of urban agglomerations based on their gross domestic product. The results surprised many: familiar leaders held their places, but some cities managed to astonish even seasoned experts.
This year, Tokyo surged ahead once more, overtaking New York and other world capitals. Economists note that the difference among the leaders is minimal, and competition is becoming increasingly intense. The top ten includes not only American and Asian cities, but also European metropolises—a sign of the growing global redistribution of economic power.
Global Leaders: Who Tops the Rankings
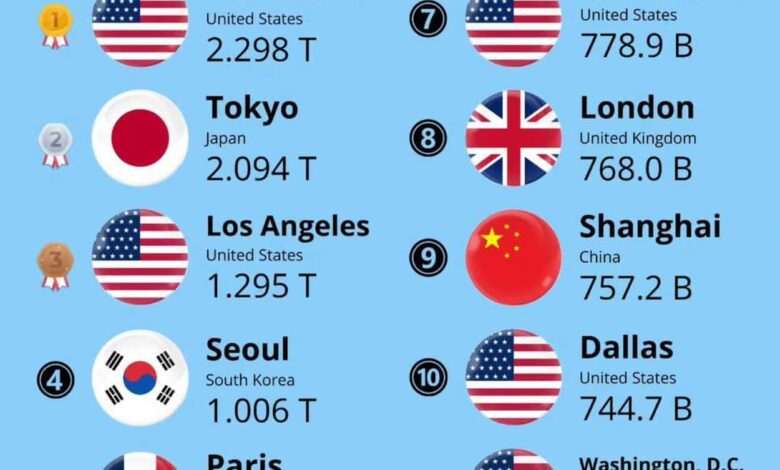
The Tokyo metropolitan area (Tokyo) claimed first place in 2025 with a GDP exceeding $2.6 trillion. New York (New York) took the second spot, with an economic output of $2.5 trillion. Los Angeles (Los Angeles) retained third place, demonstrating a GDP of $1.619 trillion.
London (London) became the wealthiest city in Europe, with a GDP reaching $1.472 trillion. The top five also includes Seoul (Seoul) with $1.419 trillion, and Paris (Paris) posting $1.394 trillion. Chicago (Chicago), Osaka (Osaka), San Francisco (San Francisco), and Shanghai (Shanghai) round out the world’s top ten economic centers.
Moscow: place in the global ranking
The Russian capital ranked 17th among the largest urban agglomerations by GDP, posting a result of $0.975 trillion. While Moscow fell behind many megacities in nominal terms, it confidently rose to second place in terms of purchasing power parity. Experts attribute this discrepancy to the specifics of calculation methods and the inclusion of different territories within agglomerations.
City rankings can vary greatly across different sources. This is due to analysts using different definitions for metropolitan boundaries and considering a range of economic parameters. Nevertheless, Moscow remains one of the key players on the global economic stage.
Calculation specifics and data discrepancies
GDP figures for urban agglomerations often differ depending on the source. For example, the data for New York is from 2023, while for Tokyo it refers to 2021. More up-to-date official figures are expected only by the end of 2025, so analysts rely on expert assessments and forecasts.
Another important factor is which territories are included in the agglomerations. In some cases, only city districts are considered, while in others suburban areas and even neighboring municipalities are included. This significantly affects the final figures and can shift the rankings.
Economic powerhouses: the competition for leadership
Despite differences in calculation methods, it is clear that the world’s largest cities continue to compete for the status of leading economic hubs. Each metropolis aims to strengthen its position by attracting investment and developing infrastructure. In the coming years, experts expect new shifts in the rankings as the global market becomes increasingly dynamic.
Leading cities not only set the pace of the global economy but also shape worldwide trends in business, technology, and culture. Their successes and failures have a direct impact on the development of entire regions and even continents.
In case you didn’t know, CEOWORLD Magazine is an international business publication specializing in analytics, rankings, and research in economics, business, and finance. The magazine regularly publishes reviews of major companies, cities, and countries, and its rankings are often used by experts and investors around the world. Founded in 2008, CEOWORLD Magazine is regarded as one of the most authoritative sources of information for top managers and entrepreneurs.